
Identify specific mechanical & electrical faults by performing sound spectrum analysis
A spectrum analyzer creates a visual image of sound. It displays the amplitude and frequency components of a recorded sound in a screen that looks similar to that of an oscilloscope (an oscilloscope shows time and amplitude).
Overview
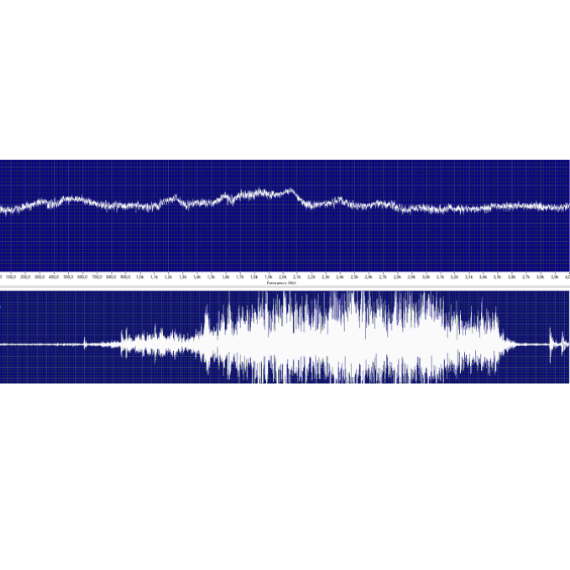
The Spectralyzer software provides the user with the tools for performing basic spectral analysis on audible sound images. The program displays spectral (FFT), time series, dual (FFT and time series), waterfall and parametric information on 5 main display windows.
Modes
- Real-time: In the real-time mode you can use the Spectralyzer as an oscilloscope in that the spectrum will be viewed as it plays a sound.
- Record mode: In the record mode you will be able to record your sounds. Make sure that the sound source (your Ultraprobe) is plugged into the mic jack of your computer. In this mode you can record and
save your recordings. - Playback Mode: In Playback Mode you can open previously recorded wave files and analyze them. You can select overlays and compare up to four wave files. Previously saved configurations can be opened for analysis.
Bearing Fault Calculator
The Bearing Fault Calculator is a tool to help quickly estimate the type of fault in either: outer race, inner race, ball pass or cage. It can be also used to get an indication of the actual motor speed by using the Set RPM button.